Module 5 · Project Manager Capstone: Rescue the Opening
Where are we now?
Measure the project at the end of week 10 with earned value: what was planned, what has been earned and what has been spent, and which tasks explain the gap.
About 35 minutes
Open in ColabEvery example as a notebook you can run, edit and save to your Google Drive.
The problem
The simulation said the plan was optimistic. Now look at what actually happened. The project is ten weeks in, and the sponsor's question is the oldest one in project management: are we on schedule and on budget? "Mostly" isn't an answer. "People are working hard" isn't an answer. "Behind, and over" might be, but only with numbers.
Earned value management (EVM) answers it with three figures in the same unit, naira: how much work was planned by now, how much has been done, and how much has been spent. The difference between them is what you manage.
The concept
The three measures
| Measure | Meaning | How |
|---|---|---|
| PV (planned value) | Budgeted cost of the work planned to be done by now | From the baseline schedule |
| EV (earned value) | Budgeted cost of the work actually done | % complete × each task's budget |
| AC (actual cost) | What has really been spent | From the project's accounts |
And the variances and indices that follow from them:
- Schedule variance SV = EV − PV (negative: behind). SPI = EV ÷ PV (below 1: behind).
- Cost variance CV = EV − AC (negative: over budget). CPI = EV ÷ AC (below 1: over budget).
- BAC (budget at completion) is the approved total budget.
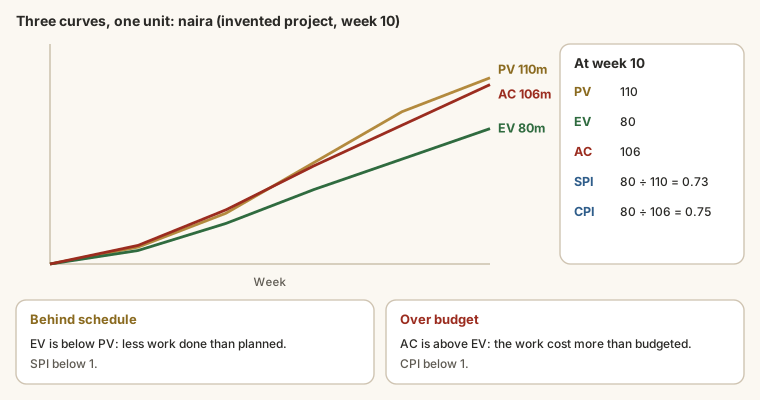
EV is the key. It values progress at the budgeted price, so it doesn't matter how much was spent: a task that is 60% done has earned 60% of its budget, whatever it cost to get there.
Two traps
- Percent complete is a judgement. "90% done" can stay 90% for weeks. Prefer measurable steps ("racking installed", "licence granted") to percentages where you can.
- Spend isn't progress. An overspend with little progress is a cost problem, not a pace problem. A project that has spent 77% of its budget on 58% of its work is in trouble, even if the spending looks "on schedule".
Example
Load the plan and the weekly status, then rebuild the baseline schedule (the same function as lesson 3):
Edit the code and press Run (Ctrl + Enter). Examples on this page share their variables, like cells in a notebook.
Output
BAC: ₦90,750,000Planned value at the end of week 10 (working day 50) is the budget of the work the baseline schedule says should be done by then:
Edit the code and press Run (Ctrl + Enter). Examples on this page share their variables, like cells in a notebook.
Output
PV ₦60,910,000   EV ₦52,675,000   AC ₦69,849,000
SV ₦-8,235,000   CV ₦-17,174,000
SPI 0.86 CPI 0.75At the end of week 10, ₦60.9m of work should have been done and ₦52.7m has been. That's a schedule index of 0.86: 14% less work done than planned. But ₦69.8m has been spent to earn ₦52.7m of work: a cost index of 0.75. The project is behind and costs a third more than planned for the work it has done, which is a harder problem than either alone.
The trend matters as much as the snapshot:
Edit the code and press Run (Ctrl + Enter). Examples on this page share their variables, like cells in a notebook.
Output
week  SPI  CPI
    2 0.96 0.96
    4 0.87 0.80
    6 0.87 0.79
    8 0.87 0.77
10 0.86 0.75Both indices are drifting down, and they haven't levelled off. Which tasks explain it?
Edit the code and press Run (Ctrl + Enter). Examples on this page share their variables, like cells in a notebook.
Output
task_id                                       name  percent_complete  cost_variance
     B4             Import and clear the analysers                63     -7497000.0
     B2    Fit-out: floors, power and air handling                97     -4176000.0
     C2 Buy computers, scanners and label printers               100     -3100000.0
A3 Obtain the facility licence 100 -1423000.0Three tasks account for most of the overspend: importing the analysers (naira costs and customs), the fit-out and the computers. The analyser import is also the critical task, and only 63% done at the point where the plan expected it to be finished.
Walkthrough
- Rebuild the baseline schedule and calculate BAC.
- Calculate PV, EV and AC at week 10 using the
earned_value()function. - Calculate SV, CV, SPI and CPI.
- Calculate the same for weeks 2, 4, 6, 8 and 10 and look at the trend.
- Find the tasks with the largest cost variance.
- Write the status summary (the task below).
Practice
Practice
What is the earned value (EV) at the end of week 10, in naira?
Practice
What is the SPI at the end of week 10? Two decimal places.
Practice
What is the CPI at the end of week 10? Two decimal places.
Practice
Which task has the largest cost overrun (the most negative cost variance) at week 10? Type its ID.
Task
12 minWrite the week 10 status summary (70 to 160 words) for the sponsor: PV, EV and AC, what SPI and CPI say, the trend, and the tasks that explain it. Lead with the answer.
Your work is checked for
- Leads with behind schedule and over budget
- Gives EV (about 52.7 million)
- Gives AC (about 69.8 or 69.9 million)
- Gives SPI (0.86)
- Gives CPI (0.75)
- Mentions the trend
- Names a task that explains it (analysers/import/fit-out/computers)
- Between 70 and 160 words
Check your understanding
Answer every question to check.