Module 8 · Excel for Data Analysis
Pivot tables
Summarise thousands of rows in seconds - by region, month, channel or rep - with pivot tables, grouping, percentages and slicers.
About 40 minutes
The problem
SUMIFS works, but a summary of revenue by region and month would need 6 × 18 = 108 formulas. The director will then ask for it by channel instead. Pivot tables build these summaries by dragging fields, and rebuild them in seconds when the question changes.
The concept
A pivot table has four areas:
| Area | Holds | Example |
|---|---|---|
| Rows | Categories down the side | region |
| Columns | Categories across the top | year |
| Values | The numbers, summarised | Sum of revenue |
| Filters | A filter for the whole pivot | channel = Wholesale |
Summarise Values By changes Sum to Count, Average, Max… Show Values As turns numbers into % of Grand Total, % of Column Total, Difference From…
Dates can be grouped into Years, Quarters and Months: right-click a date in the pivot → Group. Recent Excel versions group dates automatically when you add a date field.
Slicers are clickable filter buttons: PivotTable Analyze → Insert Slicer.
A pivot table doesn't update by itself. After the source data changes: Data → Refresh All (Ctrl + Alt + F5).
Example
Revenue by channel, with Show Values As → % of Grand Total:
| Channel | Sum of revenue | % of total |
|---|---|---|
| Wholesale | 580,264,905 | 69.9% |
| Supermarket | 210,387,665 | 25.3% |
| Kiosk | 39,888,675 | 4.8% |
| Grand Total | 830,541,245 | 100% |
Wholesalers are fewer than a quarter of Kolanut's customers but bring in 70% of revenue.
Walkthrough
- Click inside the
Orderstable (with itsrevenue,regionandcategorycolumns). - Insert → PivotTable → From Table/Range → New Worksheet, OK.
- In the PivotTable Fields pane, drag
regionto Rows andrevenueto Values. You get Sum of revenue by region. - Drag
order_dateto Columns. Excel groups it by year (click the+to see quarters and months). If it doesn't, right-click a date → Group → select Months and Years. - Right-click any revenue number → Number Format → Number, 0 decimals, with a thousands separator.
- Sort: right-click a revenue number → Sort → Largest to Smallest.
- Insert Slicer for
channel. Click Wholesale, then Kiosk, and watch the whole pivot change.
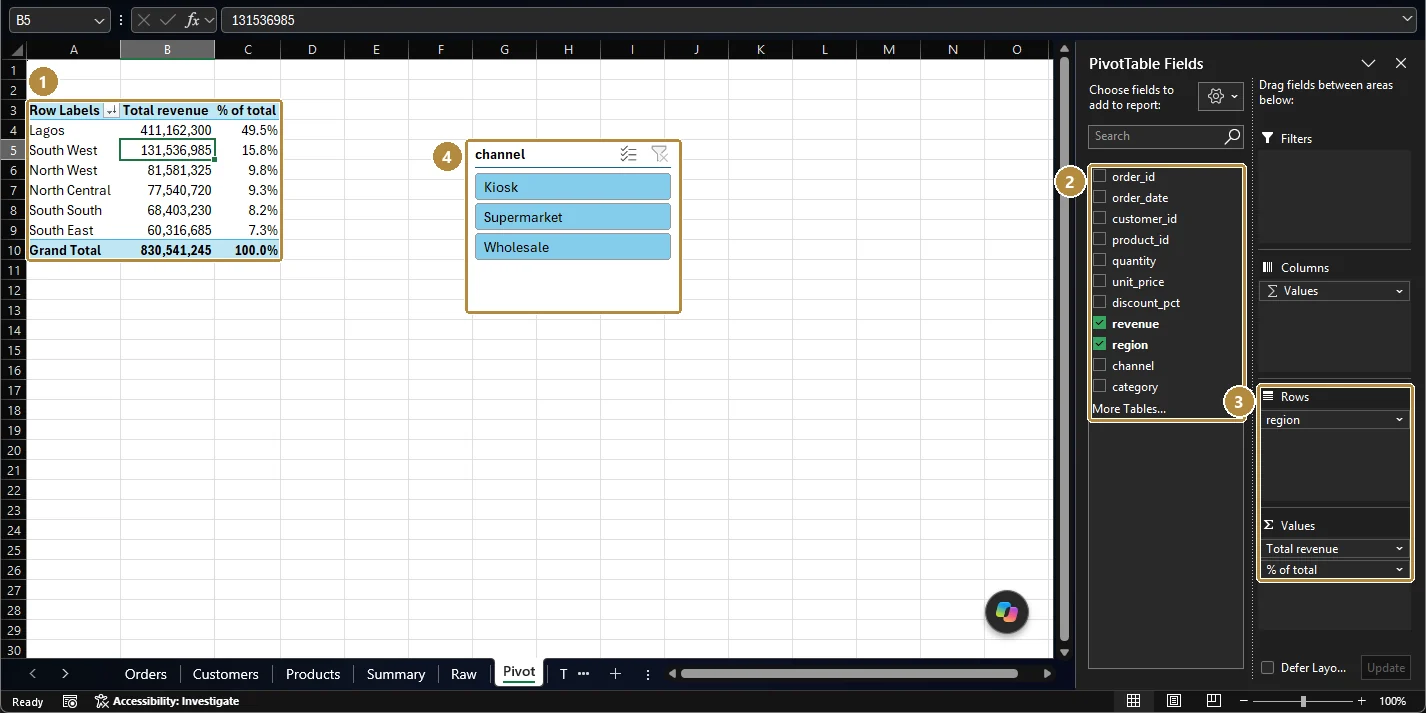
- The pivot table: region in rows, sorted by revenue, with a second value column showing % of total. Lagos is 49.5% of all revenue.
- Field list: every column of the source Table. Ticked fields are in use.
- Areas: Filters, Columns, Rows and Values. Drag fields between them to reshape the summary.
- Slicer for
channel: click Wholesale and the pivot shows wholesale revenue only.
To get the channel percentages in the Example: channel in Rows, revenue in Values twice; on the second, right-click → Show Values As → % of Grand Total.
Shortcuts for pivot tables
| Keys | Does |
|---|---|
| Alt, N, V | Insert a PivotTable |
| Alt + F5 | Refresh the selected pivot |
| Ctrl + Alt + F5 | Refresh all pivots and connections |
| Alt + ↓ (on a field in the pivot) | Filter or sort that field |
Practice
Practice
What percentage of all revenue came from Wholesale customers, to one decimal place? Build it with a pivot table.
Practice
Which sales rep brought in the most revenue in 2026 (January–June)? Give their full name.
Challenge
Challenge · optional
Which month had the highest revenue in the whole dataset? Answer with the month and year, for example March 2025.
Check your understanding
Answer every question to check.