Module 5 · Excel for Data Analysis
IF, SUMIF and COUNTIF
Make decisions inside formulas with IF, and total or count only the rows that meet conditions with SUMIFS and COUNTIFS.
About 35 minutes
The problem
Filtering answers one question at a time. But the sales director wants a table: revenue by product, lines by month, discounted lines this year. Rebuilding filters for every cell would take all day. Conditional functions calculate totals and counts for rows that meet a condition, directly in a formula.
The concept
IF: choose between two results
Excel formula
=IF(condition, value_if_true, value_if_false)
=IF([@quantity]>=20, "Large", "Small")Combine conditions with AND and OR:
Excel formula
=IF(AND([@quantity]>=20, [@discount_pct]=0), "Large, full price", "Other")For several outcomes, IFS is easier to read than nested IFs:
Excel formula
=IFS([@quantity]>=20, "Large", [@quantity]>=10, "Medium", TRUE, "Small")SUMIF and COUNTIF: one condition
Excel formula
=SUMIF(range_to_test, condition, range_to_add)
=SUMIF(Orders[product_id], 1, Orders[revenue])       revenue from product 1
=COUNTIF(Orders[discount_pct], ">0") lines with any discountSUMIFS and COUNTIFS: several conditions (note the order changes: the range to add comes first)
Excel formula
=SUMIFS(range_to_add, range1, condition1, range2, condition2, …)
=COUNTIFS(range1, condition1, range2, condition2, …)Conditions with dates or cell values are built as text with &:
Excel formula
=SUMIFS(Orders[revenue], Orders[order_date], ">="&DATE(2025,10,1), Orders[order_date], "<="&DATE(2025,12,31))That's revenue for October–December 2025: two conditions on the same column give a date range.
Example
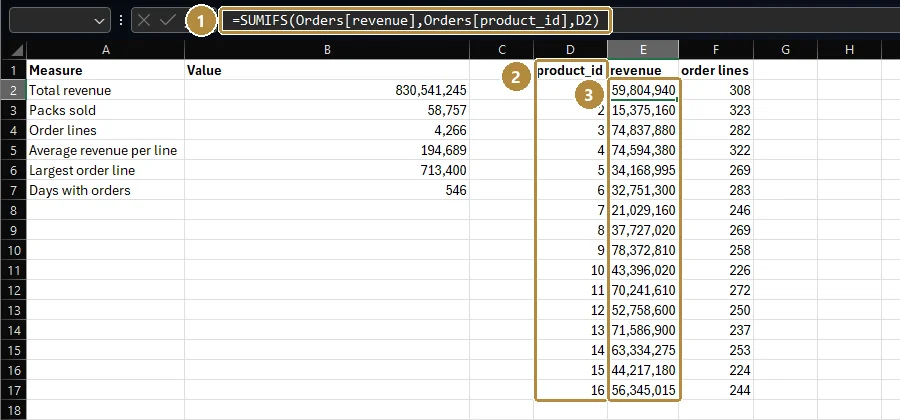
Revenue per product, as a small summary table:
| A: product_id | B: revenue |
|---|---|
| 1 | =SUMIFS(Orders[revenue], Orders[product_id], A2) |
| 2 | (copied down) |
| … | … |
Copy the formula down beside product IDs 1 to 16, and you have revenue for every product.
Here it is built on Kolanut's data, with a second column counting order lines:
Walkthrough
- Add a
sizecolumn to the Orders table:=IF([@quantity]>=20, "Large", "Small"). - Count large lines:
=COUNTIF(Orders[size], "Large"). - Revenue from product 1 (Malt drink):
=SUMIF(Orders[product_id], 1, Orders[revenue]). - Discounted lines in 2026:
=COUNTIFS(Orders[order_date], ">="&DATE(2026,1,1), Orders[discount_pct], ">0").
Check step 4 with a filter (order_date in 2026, discount_pct not 0). Two methods agreeing is the best evidence you're right.
Practice
Practice
What was the total revenue from product 1 (Malt drink 330ml), to the nearest naira?
Practice
How many order lines in 2026 had a discount greater than 0?
Practice
What was revenue in the fourth quarter of 2025 (1 October to 31 December), to the nearest naira?
Challenge
Challenge · optional
How many order lines are Large (20 packs or more)?
Check your understanding
Answer every question to check.