Module 1 · Excel for Data Analysis
Excel for analysts
Why Excel is still where most analysis happens, the parts of the screen you'll use, and the shortcuts that save hours.
About 20 minutes
The problem
Kolanut Distribution's sales team lives in Excel. Every report the managing director reads started as a spreadsheet. Analysts who move around Excel slowly (scrolling, clicking through menus, retyping) spend their day on mechanics instead of answers.
This course takes you from opening a raw file to a finished analysis. First, the ground rules for working in Excel like an analyst.
The concept
Why Excel? It's on almost every office computer, everyone can open your file, and it covers the full cycle: import, clean, calculate, summarise, chart. Larger data goes into databases and Power BI, but Excel stays the everyday tool.
The Excel window
This is Excel with Kolanut's orders loaded as a Table, exactly as you'll set it up in this course:
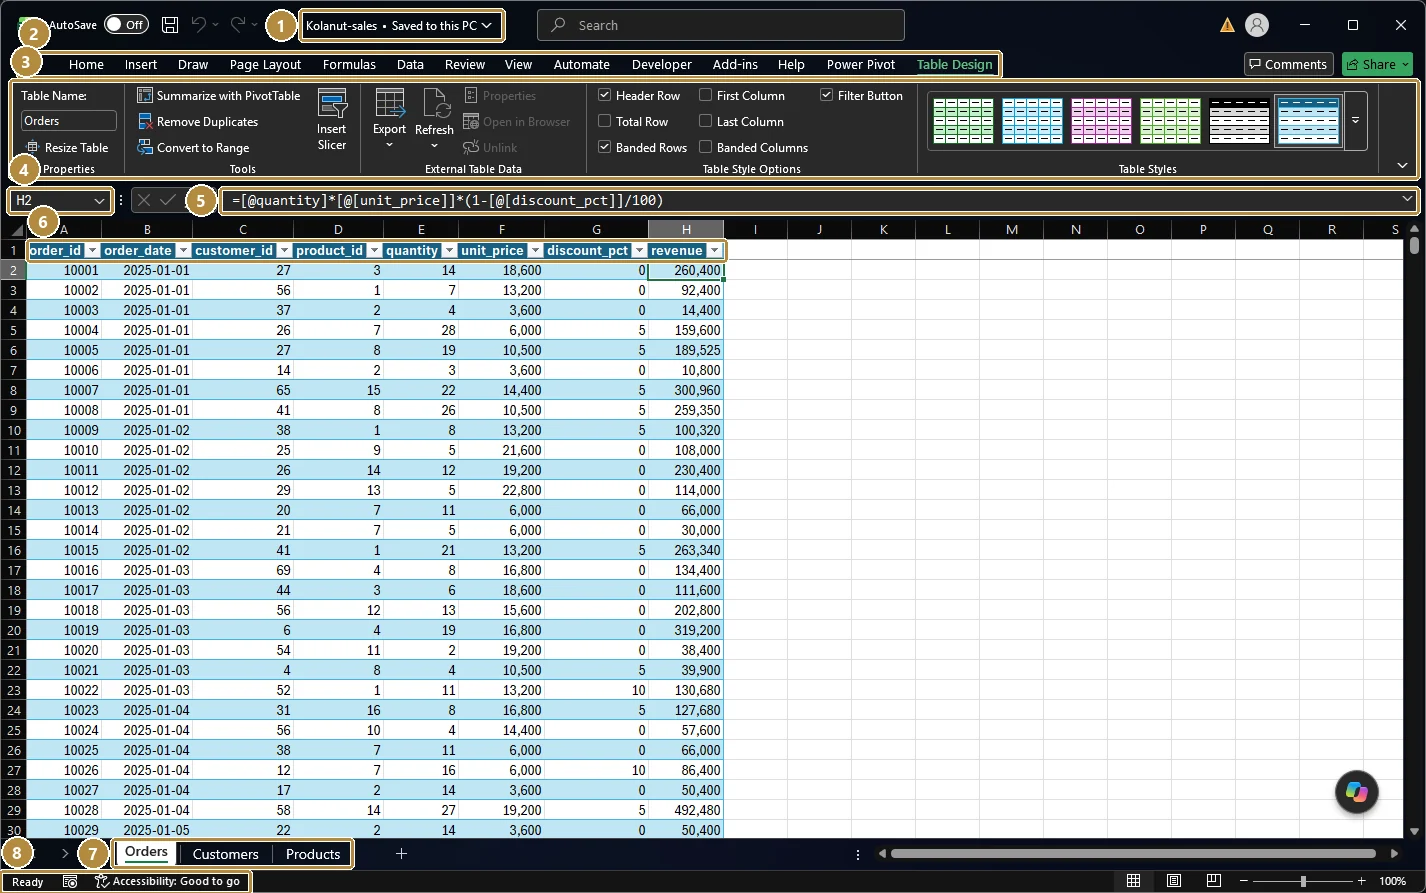
- File name. The workbook you're in (
Kolanut-sales). Click it to rename the file or see where it's saved. - Ribbon tabs. Home, Insert, Formulas, Data (import, sort, filter, remove duplicates), View… Extra tabs such as Table Design appear only when you click inside a Table.
- The ribbon. The commands for the selected tab, in labelled groups.
- Name Box. Shows the selected cell (
H2). Type an address likeA4000and press Enter to jump there. - Formula bar. Shows what's really in the selected cell. Here
H2holds a formula, not a typed number: the revenue calculation you'll write in the next lesson. - Table header row with filter buttons (the small arrows). The data is a Table, so every column can be sorted and filtered.
- Sheet tabs. One per worksheet:
Orders,Customers,Products. Click to switch, or use Ctrl + Page Up / Page Down. - Status bar. Shows the mode (
Ready), and when you select numbers it shows their Sum, Average and Count. Filtered tables report "X of Y records found" here.
What version? This course uses Microsoft 365 or Excel 2021 or later, which include XLOOKUP, FILTER and UNIQUE. Google Sheets works for almost everything too; where menus differ, we say so.
Shortcuts worth learning today (Windows; on a Mac use ⌘ for Ctrl)
| Moving around | |
|---|---|
| Ctrl + ↓ / ↑ / → / ← | Jump to the edge of the data |
| Ctrl + Home / Ctrl + End | Go to A1 / the last used cell |
| Ctrl + Page Down / Page Up | Next / previous sheet |
| Ctrl + G (or F5) | Go to a cell address |
| Selecting | |
|---|---|
| Ctrl + Shift + ↓ | Select from here to the last filled cell |
| Ctrl + Space / Shift + Space | Select the whole column / row |
| Ctrl + A | Select the current table or range (press again for the whole sheet) |
| Working with data | |
|---|---|
| Ctrl + T | Turn a range into a Table |
| Ctrl + Shift + L | Turn filters on or off |
| Alt + = | AutoSum |
| F2 | Edit the selected cell |
| F4 (while editing a formula) | Toggle $ absolute references |
| Ctrl + Z / Ctrl + Y | Undo / redo |
Example
Download Kolanut's three files. You'll use them through the whole course:
orders.csv: one row per product on an order (4,266 rows).customers.csv: one row per customer, with channel, region, city and sales rep.products.csv: one row per product, with category and current list price.
Walkthrough
- Open
customers.csvin Excel. - Click cell A1 and press Ctrl + ↓. You land on the last customer. The row number minus one (the header) is the number of customers.
- Press Ctrl + → from A1 to find the last column.
- Click anywhere in the data and press Ctrl + T, confirm My table has headers. The data becomes a Table: banded rows, filter buttons, and it will grow automatically when you add rows. Most of this course works with Tables.
- With the Table selected, look at Table Design → Table Name and rename it
Customers. Named tables make formulas readable later.
Practice
Practice
How many customers are in customers.csv?
Practice
What is the current list price, in naira, of Bottled water 75cl (12)?
Check your understanding
Answer every question to check.