Module 4 · Power BI Fundamentals
Power Query
Shape data with Power Query - applied steps, types, custom columns, merges - and profile columns to spot problems.
About 35 minutes
The problem
The orders table has quantity, price and discount, but no revenue. You could calculate it later in DAX, but a clean, well-typed revenue column at the source keeps the model simple. Power Query is where data gets shaped before it reaches the model, and every step you take is recorded, so it runs again on every refresh.
The concept
Open it: Home → Transform data. The Power Query Editor shows:
| Area | Purpose |
|---|---|
| Queries pane (left) | One query per table |
| Preview (middle) | The data after all steps so far |
| Applied Steps (right) | Every change, in order. Click a step to see the data at that point; delete a step to undo it |
| Formula bar | The M code for the selected step (View → Formula Bar if hidden) |
Transformations you'll use constantly
| Task | Where |
|---|---|
| Rename a column | Double-click its header |
| Change type | Click the type icon at the left of the header |
| Remove columns | Select → Home → Remove Columns |
| Filter rows | Header drop-down |
| Replace values | Transform → Replace Values |
| Add a calculated column | Add Column → Custom Column |
| Bring columns from another query | Home → Merge Queries (like XLOOKUP) |
| Stack tables with the same columns | Home → Append Queries |
Column profiling. View → Column quality / Column distribution / Column profile show valid, error and empty percentages, distinct counts and value frequencies. By default it profiles only the first 1,000 rows: click "Column profiling based on top 1000 rows" in the status bar and choose the entire data set.
Close & Apply (Home) saves your steps and loads the result into the model.
This is the Power Query Editor with Kolanut's three queries:
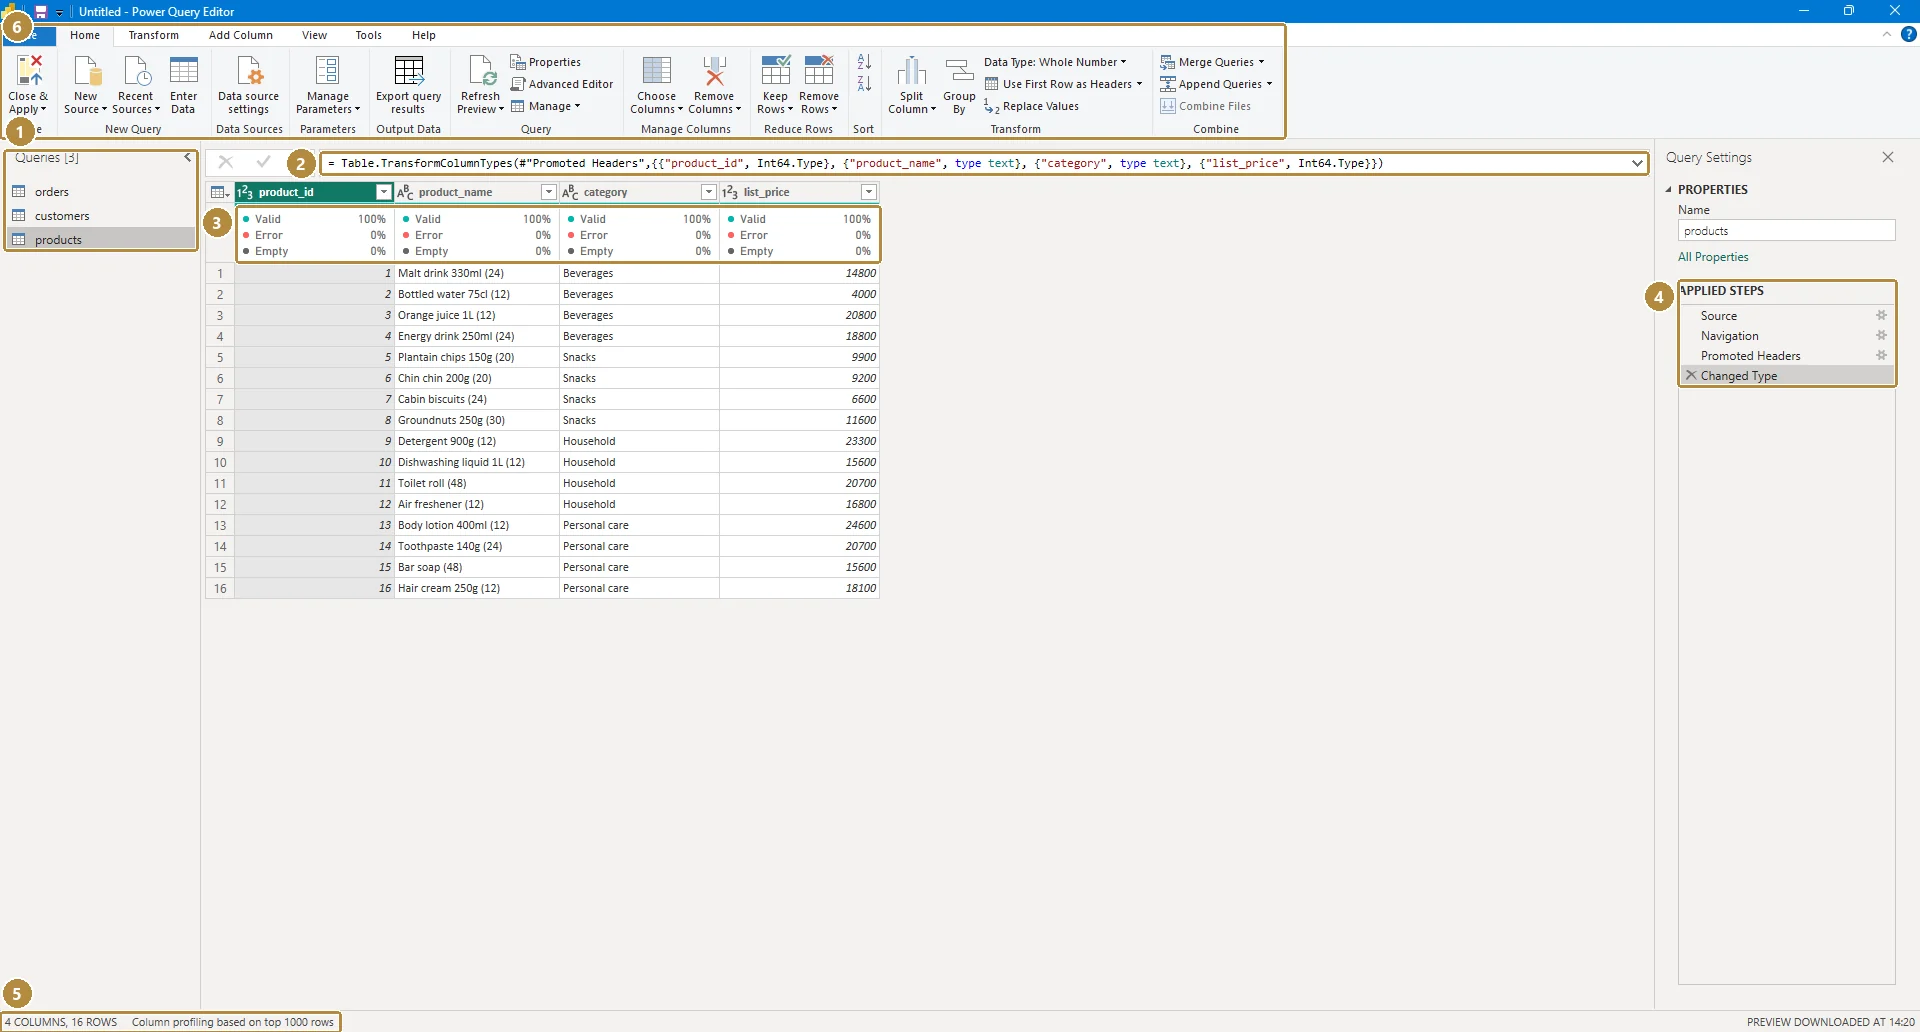
- Queries pane: one query per table.
- Formula bar: the M code for the selected step.
- Column quality: Valid, Error and Empty percentages for each column.
- Applied Steps: every change, in order.
- Status bar: Column profiling based on top 1000 rows. Click it to profile the whole table.
- The ribbon: Home, Transform and Add Column hold the transformations.
Example
The revenue custom column, in M:
Power Query (M)
= Table.AddColumn(#"Changed Type", "revenue", each [quantity] * [unit_price] * (1 - [discount_pct] / 100), type number)You don't have to type that: the Custom Column dialog writes it. In the dialog you only enter:
Power Query (M)
[quantity] * [unit_price] * (1 - [discount_pct] / 100)Walkthrough
Home → Transform data. Select the
ordersquery.View → tick Column quality and Column distribution, then switch profiling to the entire data set. All columns should be 100% valid.
Add Column → Custom Column. Name:
revenue. Formula: as above. OK.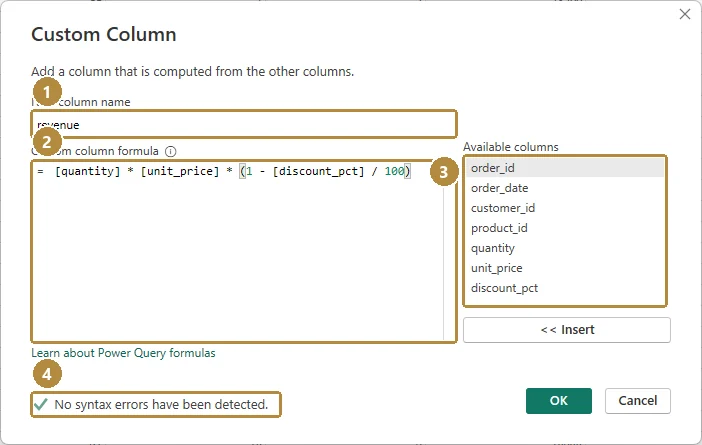
The Custom Column dialog: name (1), formula (2), the column list you can double-click to insert names (3), and the syntax check (4).Tap the image to see it full size. Click the
ABC123icon on the new column's header → Decimal Number (or Fixed decimal number, good for currency). The result: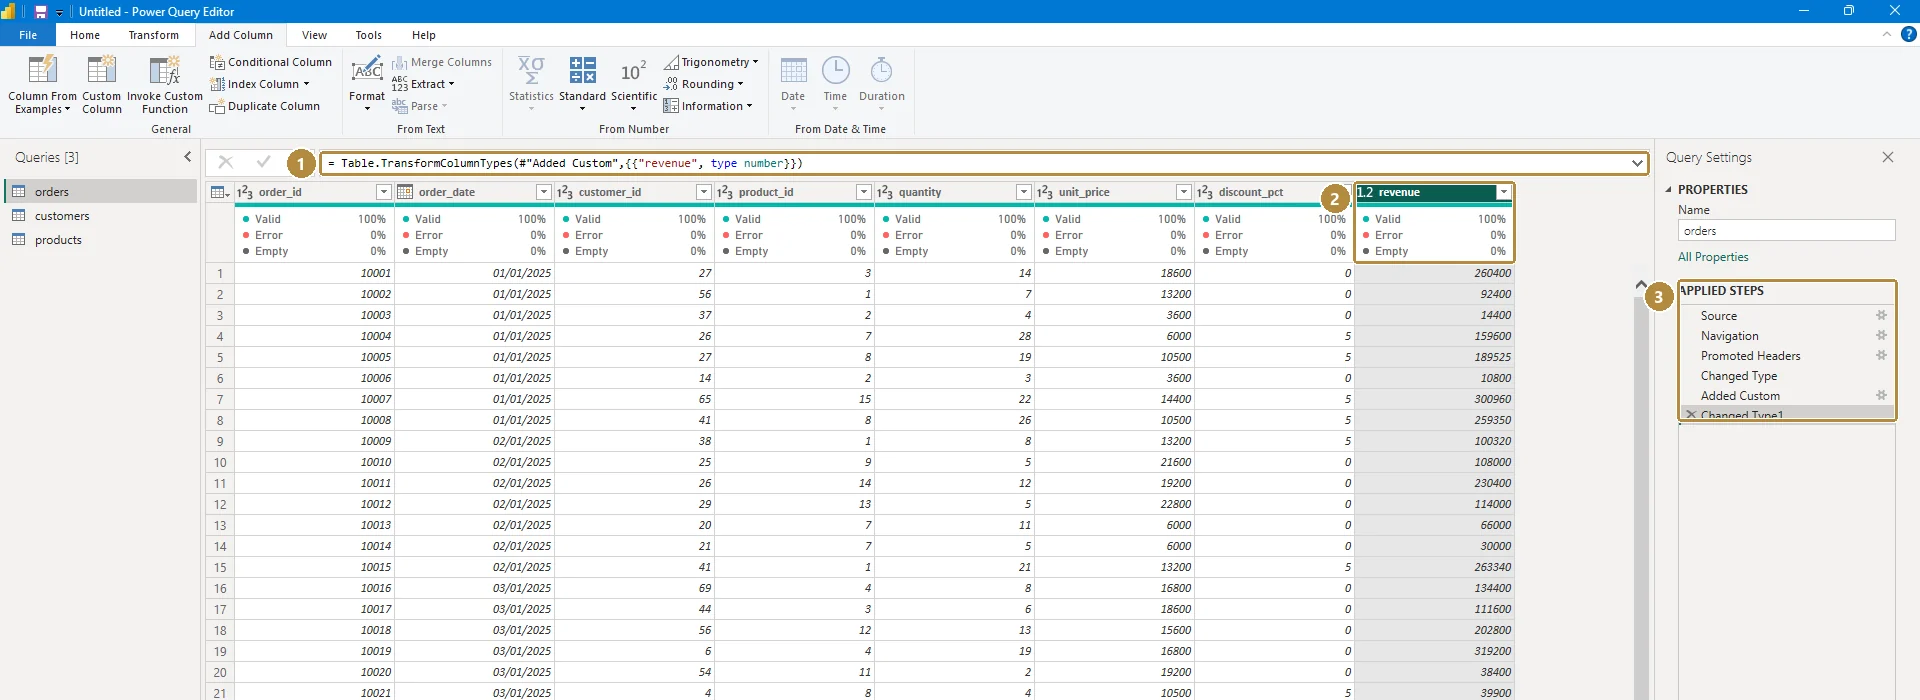
The new step's M code (1), the revenue column (2), and the two new Applied Steps (3): Added Custom, then Changed Type1 for the type change.Tap the image to see it full size. Merge the product category in:
- With
ordersselected, Home → Merge Queries. - Choose
productsas the second table; clickproduct_idin both; Join Kind Left Outer. OK. - A new column of nested tables appears. Click its expand icon (↔), untick all but
category, untick Use original column name as prefix. OK.
- With
Look at Applied Steps: each action is a step, in order.
Home → Close & Apply. Save.
Practice
Practice
Add the revenue custom column, load it, and show its total in a Card. What is total revenue, to the nearest naira?
Practice
After merging category into orders, how many packs of Snacks were sold in total?
Check your understanding
Answer every question to check.