Module 8 · Power BI Fundamentals
DAX fundamentals
The difference between calculated columns and measures, how filter context works, and the core DAX functions.
About 40 minutes
The problem
Dragging revenue into a visual gives "Sum of revenue", which is fine until you need an average per order line, a count of active customers, or a percentage of the total. Those need DAX (Data Analysis Expressions), Power BI's formula language. DAX looks like Excel, but it thinks in columns and filters, not cells.
The concept
Calculated columns vs measures
| Calculated column | Measure | |
|---|---|---|
| Calculated | Once per row, when data refreshes | On the fly, for whatever the visual is showing |
| Stored | In the table (uses memory) | Not stored |
| Use for | A value you'll filter or group by (size band, age group) | Numbers you aggregate: totals, averages, ratios |
| Example | Size = IF(orders[quantity] >= 20, "Large", "Small") | Revenue = SUM(orders[revenue]) |
Rule of thumb: if it goes in the Values well, make it a measure.
Filter context. A measure has no fixed answer. In a table of revenue by region, the measure Revenue is calculated once per row, each time filtered to that region. Slicers, page filters and visual filters add to the context. Understanding "what is filtered right now?" is most of understanding DAX.
Row context. Calculated columns, and iterator functions ending in X (SUMX, AVERAGEX), work row by row. SUMX evaluates an expression for each row of a table, then adds the results:
DAX
Revenue = SUMX ( orders, orders[quantity] * orders[unit_price] * ( 1 - orders[discount_pct] / 100 ) )This gives the same result as the Power Query revenue column plus SUM, without storing the column.
Core functions
| Function | Returns |
|---|---|
SUM(col), AVERAGE(col), MIN, MAX | Aggregates over the current filter context |
COUNTROWS(table) | Number of rows |
DISTINCTCOUNT(col) | Number of different values |
DIVIDE(a, b) | a ÷ b, returning blank instead of an error when b is 0 |
RELATED(col) | In a calculated column on the many side, the matching value from the one side |
IF, SWITCH | Conditional logic |
Example
Four measures every sales report needs:
DAX
Revenue = SUM ( orders[revenue] )

Order Lines = COUNTROWS ( orders )

Active Customers = DISTINCTCOUNT ( orders[customer_id] )

Avg Revenue per Line = DIVIDE ( [Revenue], [Order Lines] )Notice the last one uses the others: measures build on measures. Change Revenue once and everything using it follows.
A calculated column using a relationship:
DAX
Category = RELATED ( products[category] )Walkthrough
Create a table for your measures: Home → Enter data, name it
_Measures, load it with its one empty column. (The underscore keeps it at the top of the Data pane.)Select
_Measures, then Home → New measure, and type theRevenuemeasure in the formula bar. Press Enter.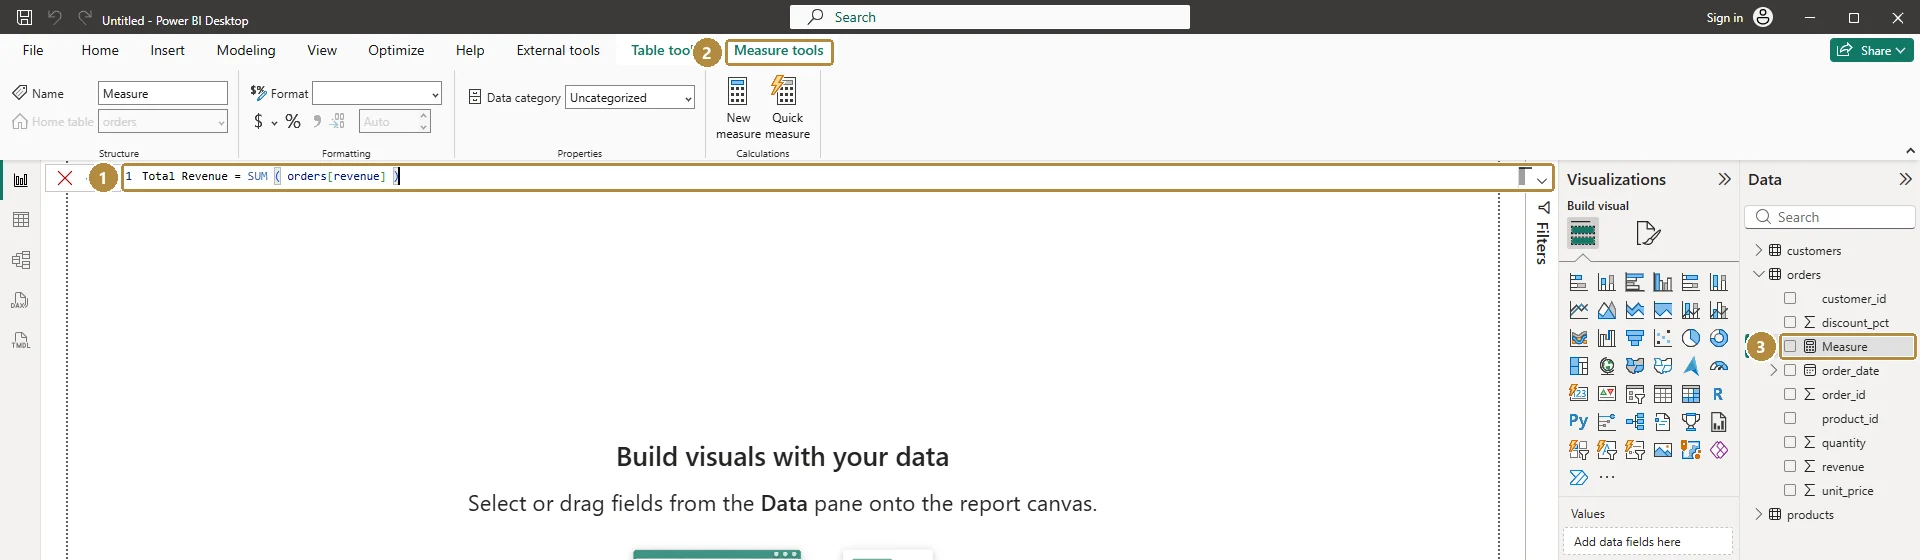
Writing a measure: the formula bar (1) opens under the Measure tools tab (2), and the measure appears in the Data pane with a calculator icon (3).Tap the image to see it full size. Add
Order Lines,Active CustomersandAvg Revenue per Linethe same way.Format them: select a measure → Measure tools → set format (Whole number with thousands separator for counts; currency for revenue).
Build a Matrix with
Date[Year]in Rows and all four measures in Values. Each number is calculated for its year: that's filter context at work.Delete the empty column in
_Measures; the table becomes a measure folder.
Practice
Practice
What is Avg Revenue per Line for 2026 (January–June), to the nearest naira?
Practice
How many order lines were there in Q1 2026 (January–March)?
Check your understanding
Answer every question to check.