Module 6 · Power BI Fundamentals
Data relationships
Connect tables with one-to-many relationships so filters flow from customers and products to orders.
About 30 minutes
The problem
You put region from the customers table and revenue from orders into a bar chart, and every bar shows ₦830.5 million. Power BI doesn't know which orders belong to which region. The tables need a relationship.
The concept
A relationship links two tables through a column they share, usually an ID.
- Cardinality. Almost always one-to-many (shown as
1and*): one customer, many orders. The "one" side must have unique values;customers[customer_id]does. - Cross-filter direction. The arrow on the line shows which way filters flow. Single (from the one side to the many side) is the default and the right choice almost always: choosing a region filters the customers, which filters their orders.
- Active vs inactive. Only one active path can exist between two tables; others show as dashed lines and are used only when a DAX formula asks for them.
Star schema. The standard design, which the next lesson explores further:
            customers
                │ 1
                │
products ─1───* orders *───1─ Date- Fact table in the middle: events with numbers (orders).
- Dimension tables around it: the things you filter and group by (customers, products, dates).
Filters flow from dimensions into the fact table. Put fields from dimensions on axes and slicers, and numbers from the fact table in values.
Example
Here is Kolanut's model in Model view, with the relationships Power BI detected when the tables were loaded:
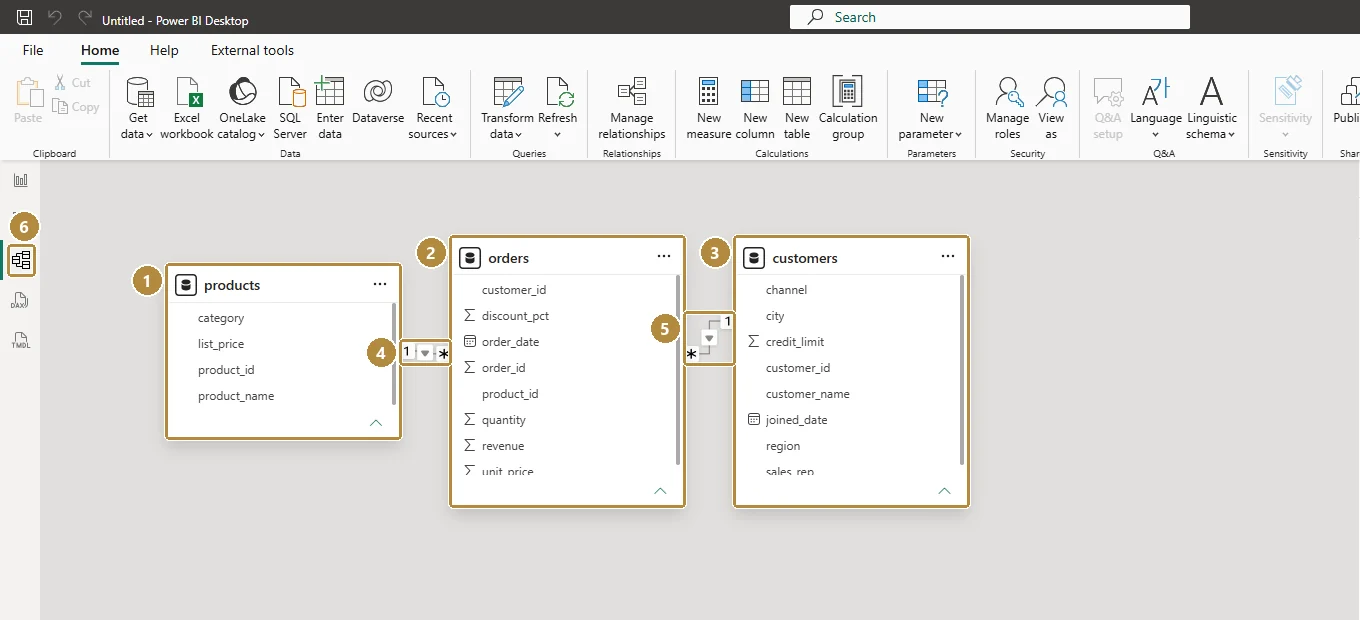
Read each line: the 1 sits beside the table where each ID appears once (products, customers); the * (many) sits beside orders. The small arrow on the line shows the filter direction: from the one side into orders.
With the relationship customers[customer_id] (1) → orders[customer_id] (*):
| region | revenue |
|---|---|
| Lagos | ₦411.2m |
| South West | ₦131.5m |
| North West | ₦81.6m |
| North Central | ₦77.5m |
| South South | ₦68.4m |
| South East | ₦60.3m |
Without it, every row shows ₦830.5m.
Walkthrough
- Go to Model view. Power BI may already have created relationships: it auto-detects matching column names on load. Check them rather than trusting them.
- If
customersandordersaren't connected, dragcustomer_idfromcustomersontocustomer_idinorders. - Double-click the line to open Edit relationship. Check: Cardinality Many to one (*:1) from orders to customers; Cross filter direction Single; Make this relationship active ticked.
- Do the same for
products[product_id]→orders[product_id]. - If you merged
categoryinto orders in lesson 4, delete that column now (in Power Query, delete the merge steps) and useproducts[category]instead. - Back in Report view, build a table visual with
customers[region]andorders[revenue]. Each region should show a different number.
Practice
Practice
With the relationships in place, what is total revenue from South East customers, to the nearest naira?
Practice
In the relationship between products and orders, which table is on the one side?
Check your understanding
Answer every question to check.