Module 3 · Power BI Fundamentals
Importing data
Load CSV files into Power BI, choose between Load and Transform Data, and check that what arrived is complete and correctly typed.
About 25 minutes
The problem
Kolanut's data is in three CSV files. Before you can chart anything, they have to come into Power BI whole, with numbers as numbers and dates as dates. A file that loads with the wrong types, or a truncated preview mistaken for the full data, causes problems that surface much later as "wrong" numbers.
The concept
Get data (Home → Get data) connects to hundreds of sources: Excel workbooks, CSV and text files, folders, SQL databases, SharePoint, web pages and online services.
For a CSV, Power BI shows a preview of the first rows with its guess at the delimiter and types, then two buttons:
| Button | Does |
|---|---|
| Load | Loads the data as it is into the model |
| Transform Data | Opens Power Query to clean and shape it first (next lesson) |
Import mode. Loading copies the data into the .pbix file. That makes reports fast. To see new data you Refresh (Home → Refresh), which re-reads the source files.
Check what arrived, every time:
- Row counts: in Table view the row count for the selected table appears at the bottom-left of the window. Compare it with the source.
- Types: each column's type shows in Table view under Column tools → Data type. Numbers should be Whole number or Decimal number, dates should be Date.
- Obvious oddities: blanks where you expect values, dates in the wrong century, IDs shown as decimals.
Example
Kolanut's files, once loaded:
| Table | Rows | Key columns |
|---|---|---|
orders | 4,266 | order_id, order_date (Date), customer_id, product_id, quantity, unit_price, discount_pct |
customers | 90 | customer_id, customer_name, channel, region, city, sales_rep, joined_date, credit_limit |
products | 16 | product_id, product_name, category, list_price |
Walkthrough
Open
kolanut-sales.pbixfrom the last lesson.Home → Get data. The full list of sources opens:
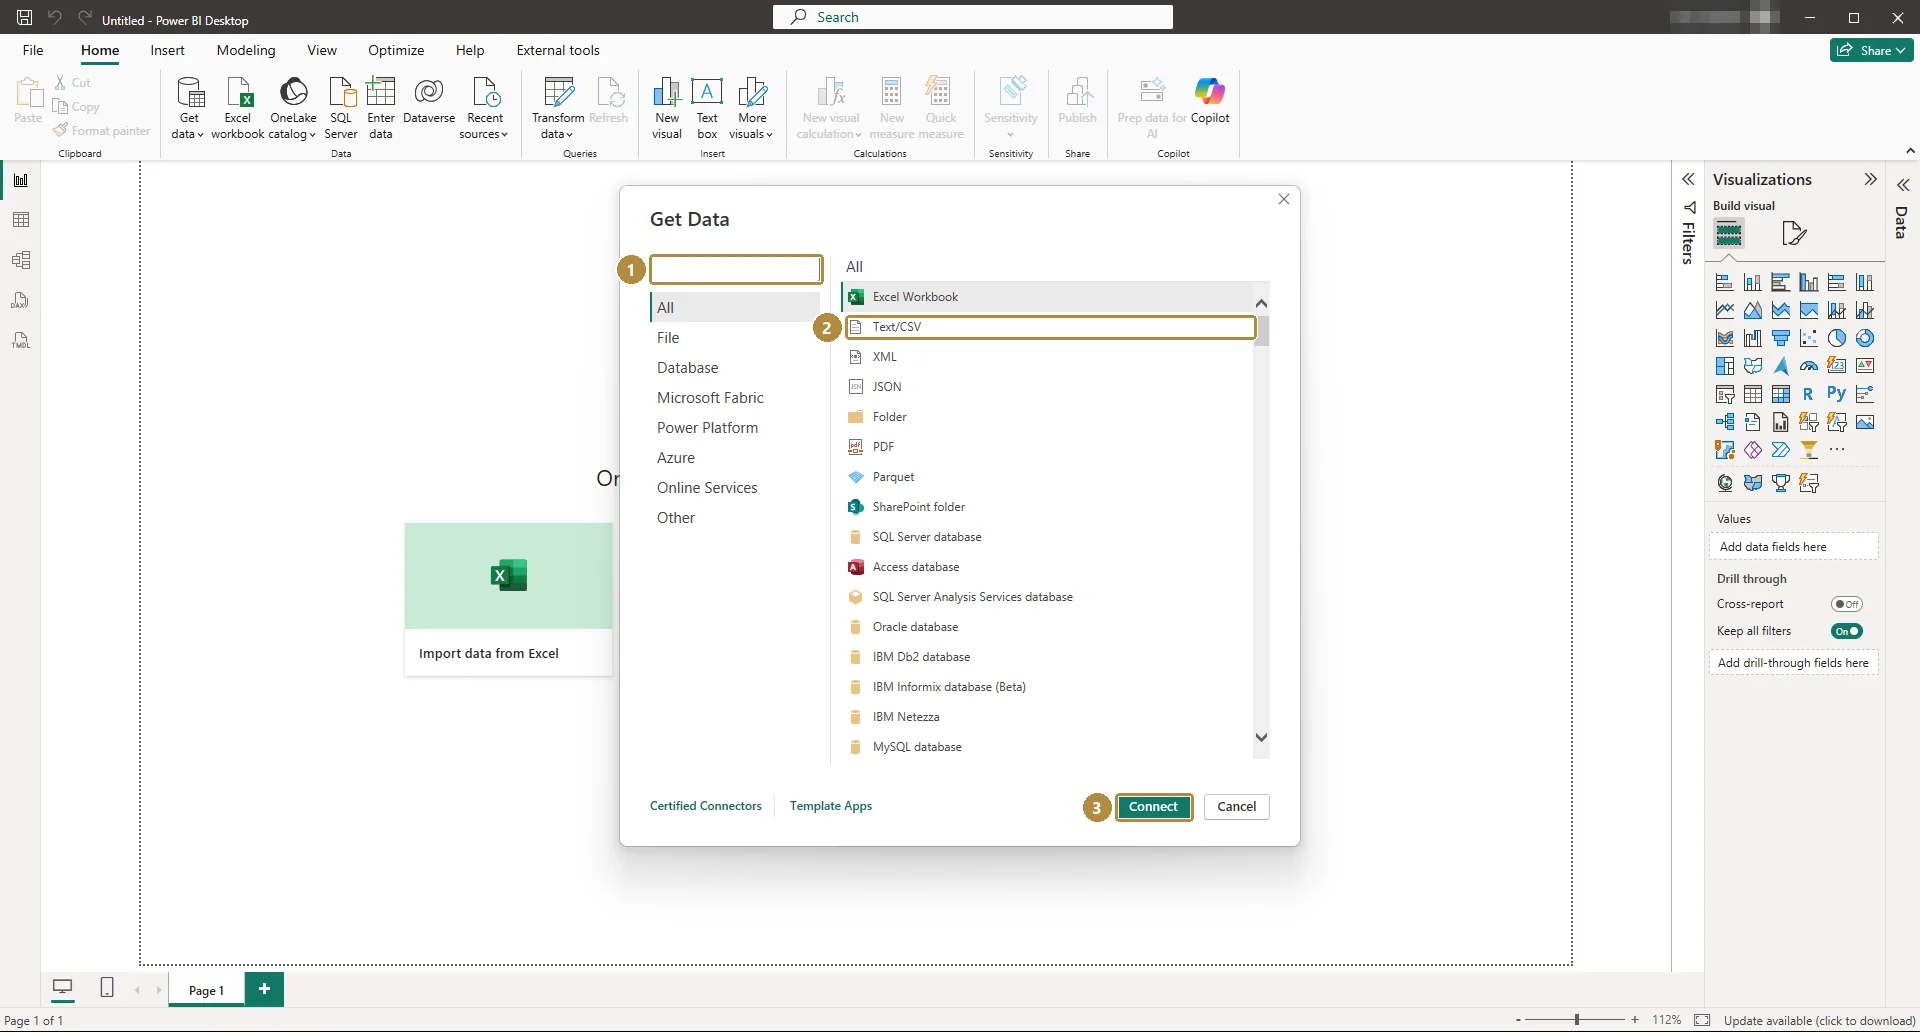
Get Data. Type in the search box (1) to find a connector quickly.Tap the image to see it full size. Choose Text/CSV (2), then Connect (3), and pick
orders.csv.Power BI shows a preview:
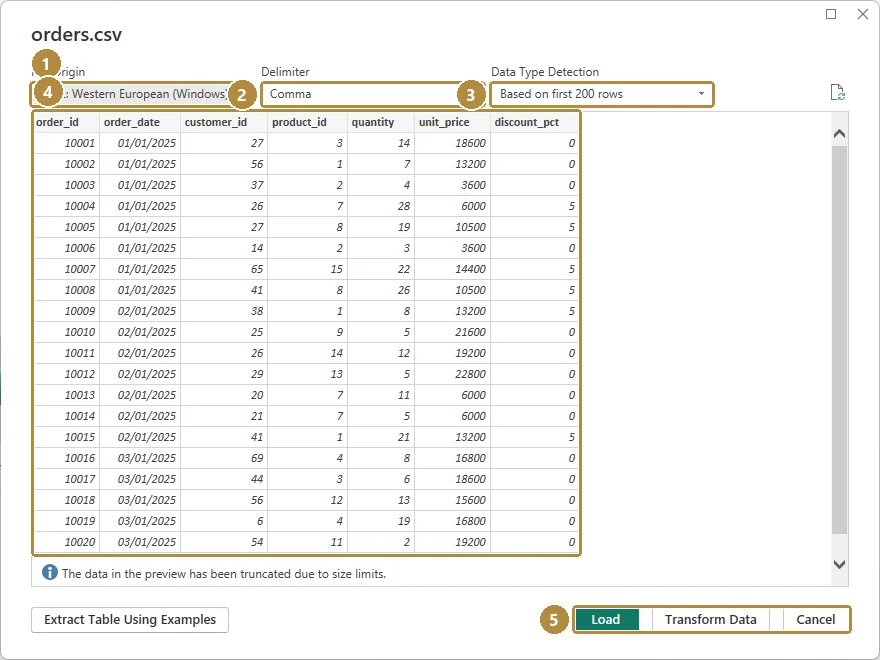
The CSV preview: encoding (1), delimiter (2), type detection (3), a sample of rows (4), and Load or Transform Data (5).Tap the image to see it full size. Check the delimiter is Comma and the columns look right. Click Load.
Repeat for
customers.csvandproducts.csv.Switch to Table view. Select each table in the Data pane and read the row count at the bottom of the window:
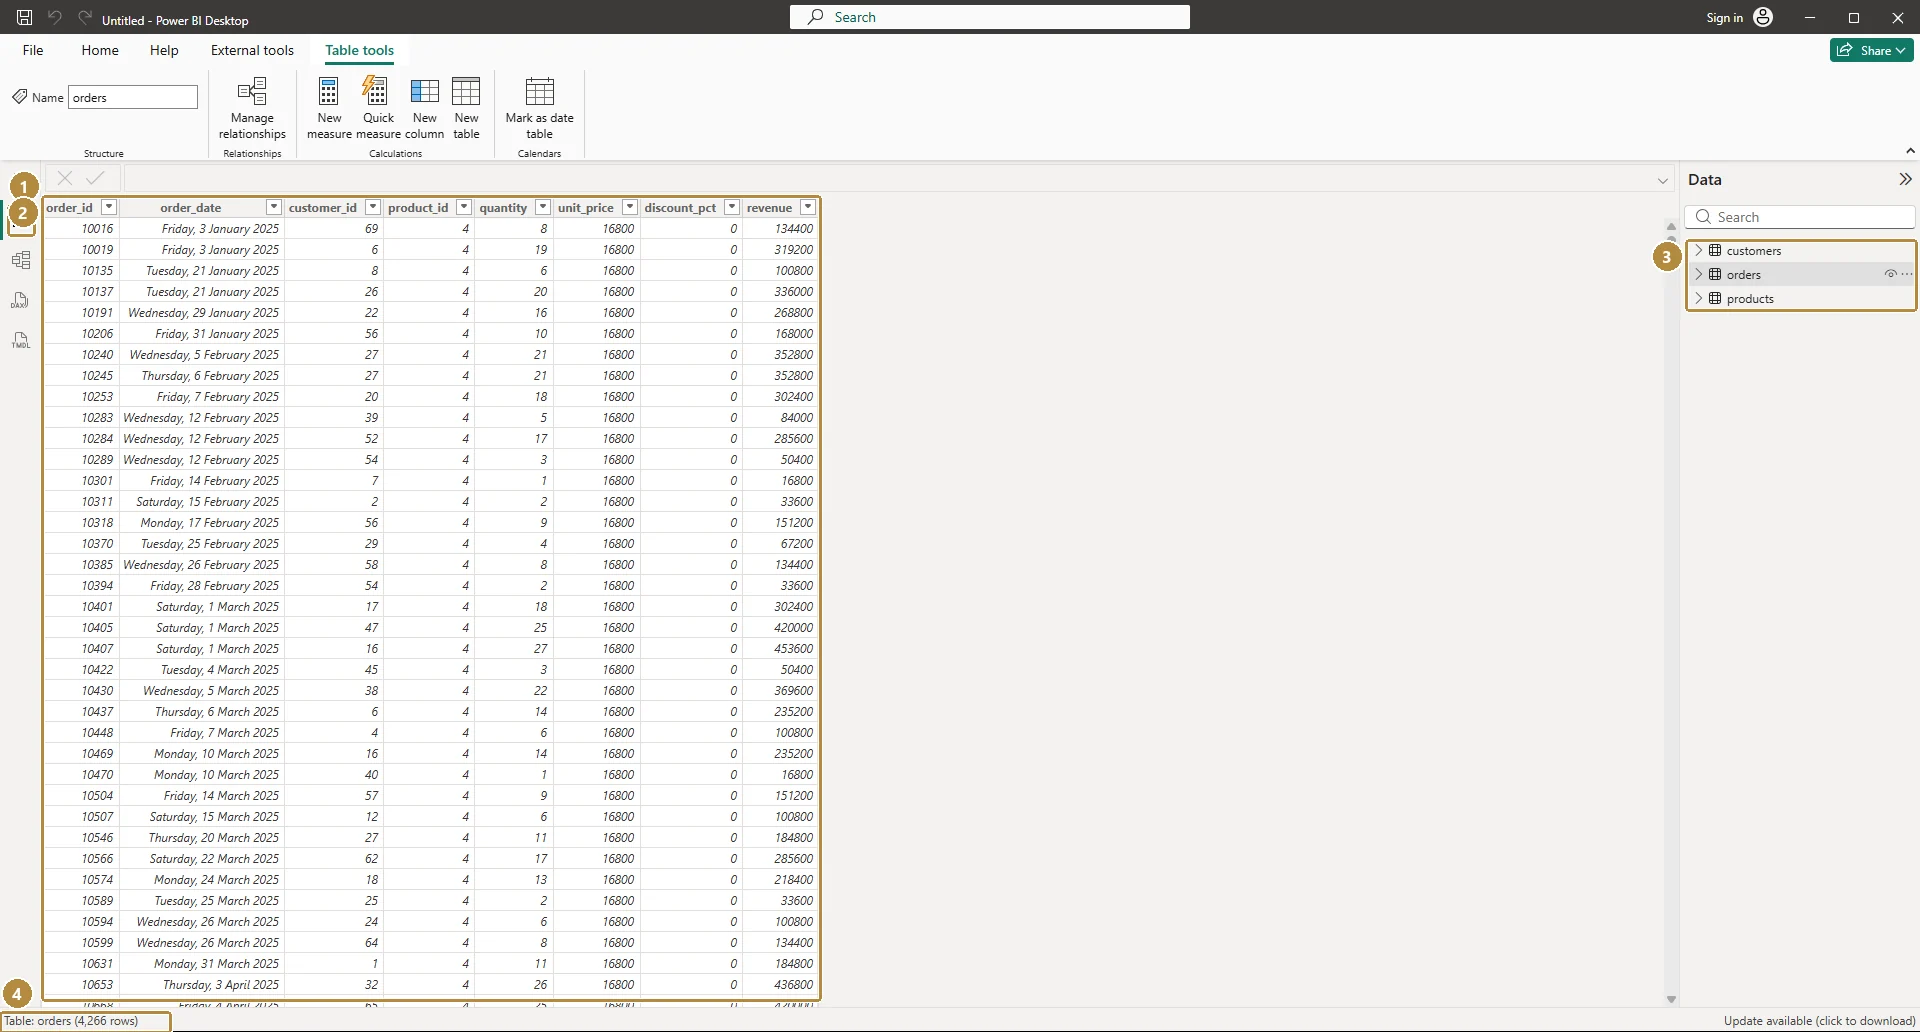
Table view (1): the rows of the selected table (2), the tables in the model (3), and the row count (4): 4,266 for orders.Tap the image to see it full size. Click the
order_datecolumn and check Column tools → Data type says Date.Save.
Practice
Practice
After loading, how many rows does the orders table have in Power BI?
Practice
How many different customers placed an order in June 2026? Build a Card visual with customer_id from orders, set to Count (Distinct), and filter order_date to June 2026.
Check your understanding
Answer every question to check.