Module 2 · Power BI Fundamentals
The Power BI interface
The four views of Power BI Desktop, the panes you'll use constantly, and how report pages work.
About 20 minutes
The problem
Power BI Desktop opens to a blank canvas and a lot of panes. New users click around, can't find where their data went, or can't work out why a visual shows the same number in every bar. Knowing the layout saves hours of confusion.
The concept
Four views (icons down the left edge):
| View | What you do there |
|---|---|
| Report view | Design pages: add visuals, arrange them, format them |
| Table view | Look at the rows in each loaded table; check types and values |
| Model view | See tables as boxes and the relationships between them |
| DAX query view | Write and test DAX queries (useful later for checking measures) |
(Older guides call Table view "Data view".)
Panes in Report view (right side):
- Data pane: every table, column and measure in your model. Tick or drag a field to use it.
- Visualizations pane: choose a visual type, then drop fields into its wells (Axis, Values, Legend…). The paintbrush icon opens Format visual.
- Filters pane: filters for the selected visual, the current page, or all pages.
The ribbon across the top: Home (Get data, Transform data, Publish), Insert, Modeling (new measures, tables, relationships), View (themes, gridlines, mobile layout).
Report pages are tabs along the bottom, like worksheets. A report usually has an overview page and a few detail pages.
File types: your work is saved as a .pbix file, which holds the data, model and report together.
Example
This is Power BI Desktop with a new, empty report:
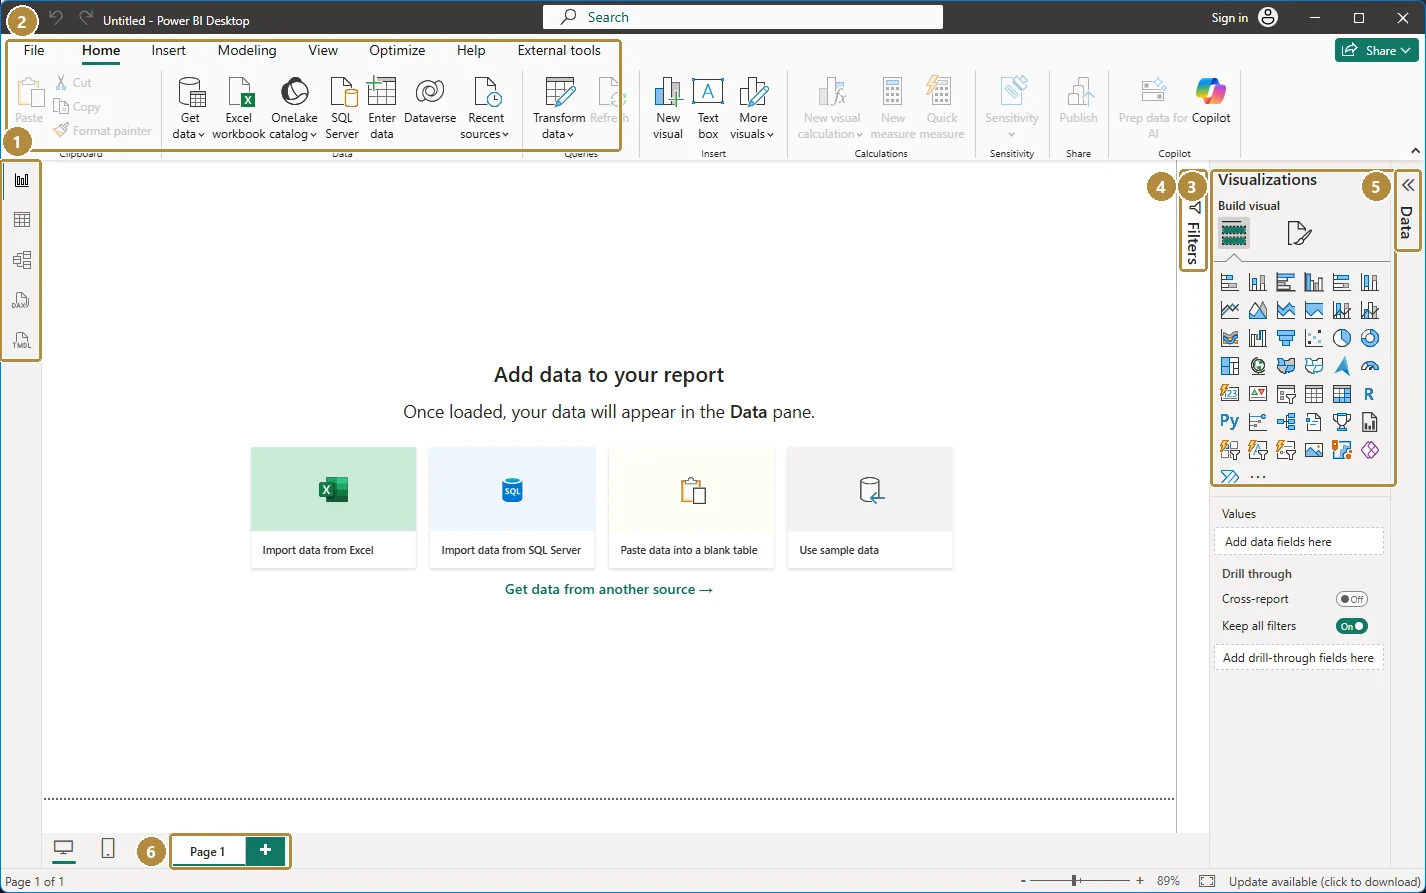
- View switcher: Report, Table, Model, DAX query and TMDL view, top to bottom.
- Ribbon: File and the Home, Insert, Modeling, View… tabs. Get data and Transform data live on Home.
- Visualizations pane: pick a visual type, then fill its wells (Values, Axis…) below.
- Filters pane (collapsed here): click to open it.
- Data pane (collapsed here): your tables, columns and measures appear here once data is loaded.
- Page tabs: one per report page; + adds a page.
A new visual, step by step: in Report view, tick revenue in the Data pane and Power BI creates a column chart with one bar. Then tick region and it becomes revenue by region. The fields you tick land in the wells of the selected visual; changing the visual type in the Visualizations pane keeps the same fields.
Walkthrough
- Open Power BI Desktop and close the start screen.
- Hover over each icon on the left edge to find Report, Table, Model and DAX query view.
- On the right, find the Data, Visualizations and Filters panes. If one is missing: View → Show panes.
- Click the + at the bottom to add a page; double-click a page tab to rename it.
- File → Save as: save the empty report as
kolanut-sales.pbixin the same folder as the course CSV files. You'll build on it in every lesson.
Handy shortcuts in Power BI Desktop
| Keys | Does |
|---|---|
| Ctrl + S | Save |
| Ctrl + Z / Ctrl + Y | Undo / redo (in Report view) |
| Ctrl + C, Ctrl + V | Copy and paste a visual, formatting included |
| Ctrl + click | Select several visuals at once |
| Enter | Confirm a formula in the formula bar |
| Shift + Enter | New line inside a DAX formula |
| Esc | Cancel a formula edit |
Practice
Practice
Which view do you open to see and create relationships between tables?
Practice
Which view lets you scroll through the actual rows of a loaded table to check its values?
Check your understanding
Answer every question to check.