Module 7 · Data Modelling
Dimensional modelling
Model for analysis with facts and dimensions, choose the grain first, and build the star schema that Power BI works best with.
About 35 minutes
The problem
A normalised database is ideal for recording business: each fact once, easy to update. But a report that asks "revenue by region, category and month" may need six or seven joins through it. Analytics models are shaped differently: around the events you measure and the ways you slice them. That's dimensional modelling.
The concept
A dimensional model has two kinds of table:
| Fact table | Dimension table | |
|---|---|---|
| Holds | Events and their numbers | Descriptions used to filter and group |
| Examples | Order lines, payments, hearings, attendance | Date, customer, product, sales rep, court |
| Columns | Foreign keys + measures (quantity, revenue) | A key + text attributes (name, region, category) |
| Shape | Long and narrow: many rows | Short and wide: fewer rows, more columns |
Put together, the fact sits in the middle and the dimensions around it: a star schema.
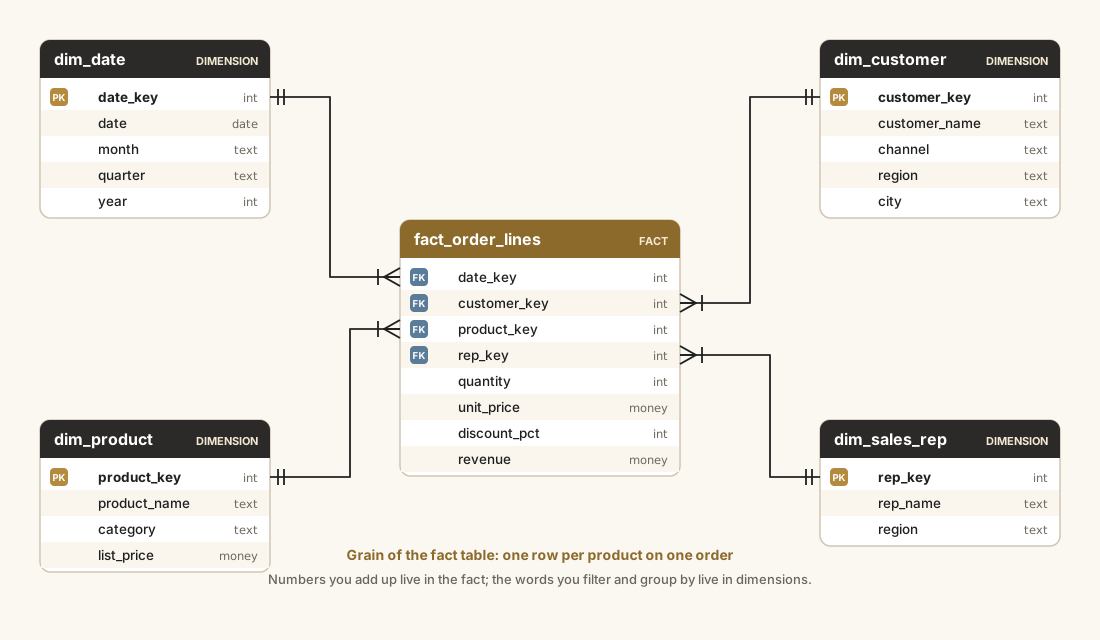
Kimball's four steps (from Ralph Kimball, who popularised the method):
- Choose the business process: taking orders.
- Declare the grain: one row per product on one order.
- Identify the dimensions: when (date), who (customer, rep), what (product).
- Identify the facts: quantity, price, discount, revenue.
Grain first, always. Every measure in the fact table must be true at that grain. credit_limit is a fact about a customer, not an order line; put it in the fact table and summing it across lines would multiply it.
Dimensions are allowed to repeat. dim_customer can hold region and sales_rep as text, even though that repeats values a normalised database would split out. Analysts filter by them constantly; one join is worth the repetition.
Example
You've already built one. In the Power BI course, Kolanut's model looks like this:
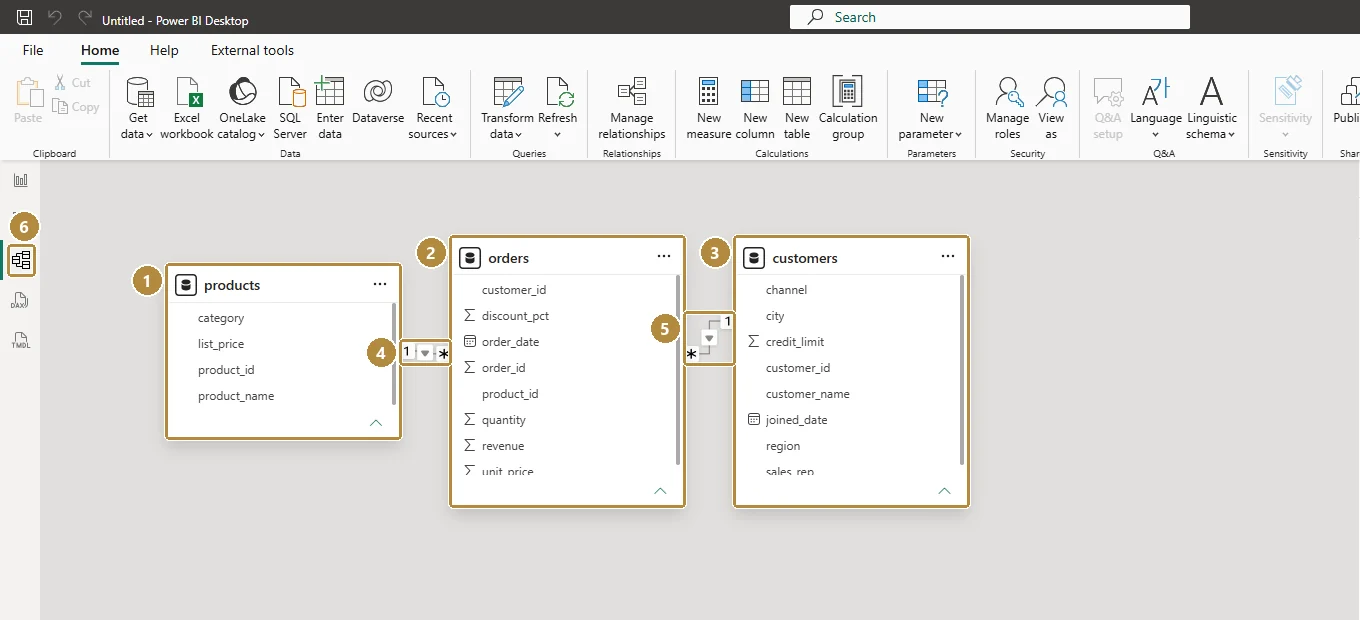
orders is the fact table; products and customers are dimensions. Add a date table (as the Power BI course does) and you have a complete star.
Walkthrough
Designing a star for Ashgrove Chambers' billing:
- Process: issuing invoices.
- Grain: one row per invoice.
- Dimensions: date issued, client, matter (with practice area and responsible lawyer), status.
- Facts: amount billed, days to pay (for paid invoices).
- Questions it answers: billed per practice area per month; overdue amount per client; average days to pay by lawyer.
A second star for court work would have a different grain (one row per hearing), sharing the date, client and matter dimensions. Shared dimensions are called conformed dimensions: they let you compare billing and hearings side by side.
Practice
Practice
For analysing Ashgrove Chambers' billing, which of its four tables (clients, matters, hearings, invoices) is the fact table?
Practice
How many rows would that billing fact table have? (Count the rows in invoices.csv.)
Check your understanding
Answer every question to check.